Problem 1
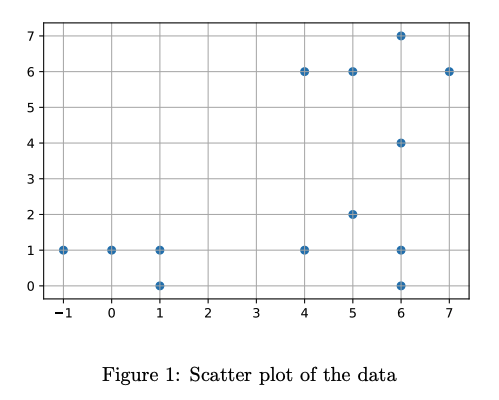
Figure 1 shows a scatter plot of your two-dimensional data ( instances). You want to apply a non-linear dimensionality reduction technique based on neighbor graphs (e.g. T-SNE or UMAP). As a first step you compute the , weighted adjacency matrix representing the neighbor graph. Assume that the weights are computed as
where and you set . Finally, you obtain the similarity between instances and with .
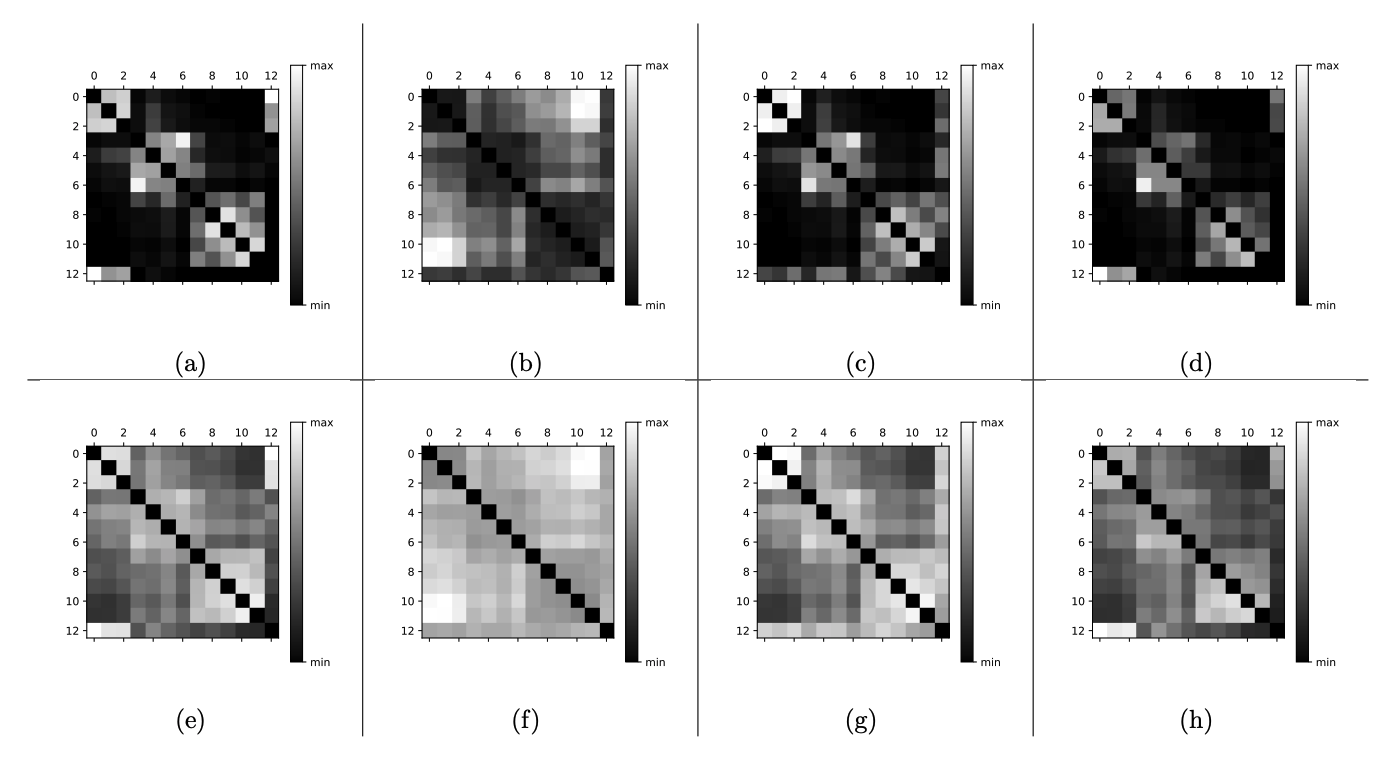
Which of the following neighbor graph plots (pixel in position shows the value of ) corresponds to the given dataset and the stated formula for ? What is your answer for ? Justify your answers!
Solution
By looking at the scatter plot of the data, it is apparent that we have three clusters of points with varying densities.
Now, how does the parameter impact the resulting similarity matrix? Below, we have plots for the Gaussian kernels used for computing weights with different values of :
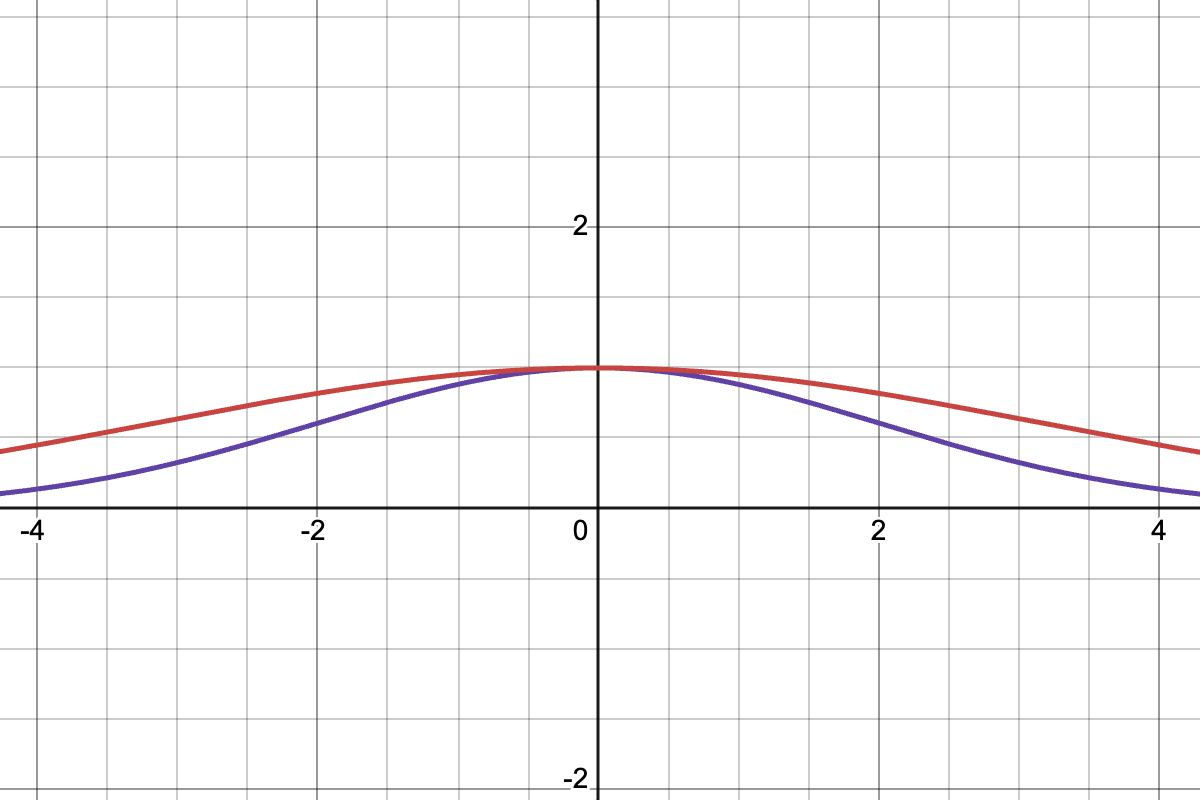
The red one has , and the purple one has . One can think of the parameter as representing our assumption about the density of the data. If the data is sparse, then choosing larger values of would boost the similarity scores, irrespective of the larger absolute distance between the points.
Given these two observations, we would like to see two graphs that have:
- Three clusters of sizes: 4×4, 4×4, and 5×5.
- In one of the graphs, the clusters appear larger because the pixels are dimmed less with increasing distance.
Let’s analyze each graph one by one based on our criteria:
- a) We have three visible clusters, and they are relatively dense. This is a perfectly valid candidate for a similarity matrix computed with .
- b) Something is off in this case. The similarity values increase (i.e., pixels get brighter) as distances between points increase. Perhaps a pure distance metric was used to compute the similarity scores without passing the distance values through the Gaussian kernel.
- c) The devil is in the details here. We know that the largest square should be 5×5 since the largest cluster contains five points. However, the graph shows a visible cluster of size 6×6.
- d) Everything looks perfectly fine, except… the matrix is not symmetric. This cannot be the case, as similarity scores are given by a symmetric function: .
- e) This similarity matrix resembles matrix a), albeit it is brighter, which means that the average similarity scores are higher. This would align with using a Gaussian kernel parameterized with a higher , such as 5.
- f) On the other hand, this matrix follows a pattern similar to matrix b), where larger distances between points result in higher similarity scores, so we can rule it out.
- g) Again, we encounter the same issue as in c)—this could have been a valid matrix for , but not for the data given in the provided scatter plot.
- h) This matrix has the same issue as d)—it is clearly not symmetric.